| Past Effectiveness Reviews | |||||
The Effectiveness of Psychological Interventions in Routine Practice
A research seminar for:
The University of Sheffield Psychology

Dr. Chris Gaskell
Senior Clinical Psychologist
Neuropsychology
North Staffordshire Combined Healthcare NHS Trust
Aims For This Talk
Overview of Practice Based Evidence.
Rationale for the Current Study.
Findings & Limitations.
Recent Developments.
Background
What Have we Learnt from Psychotherapy Research RCTs?
Psychotherapy works! ✅.
Different therapies fare about equal (i.e., Dodo Bird Effect 🐦).
Some therapists produce greater outcomes (Super Shrinks? 🦸).
Providing feedback on progress leads to greater outcomes 🆙🍄.
Much improvement is actually achieved in the early sessions.
The Problems with RCTs?
Advantages of RCTs
✅ Reduction of bias
✅ High internal validity
✅ Reproducibility
✅ Objective and reliable
However:
- ❌ High cost and resource-intensive
- ❌ Ethical issues
- ❌ Limited external validity
But do Finding Hold True in (Routine) Practice?
Many reasons to expect that that the effects of psychotherapy delivered in routine care settings may differ from RCTS:
Geographical effects.
Provision.
Empirically Supported Treatments.
Integrity.
So what do we do… ?
Practice-Based Evidence

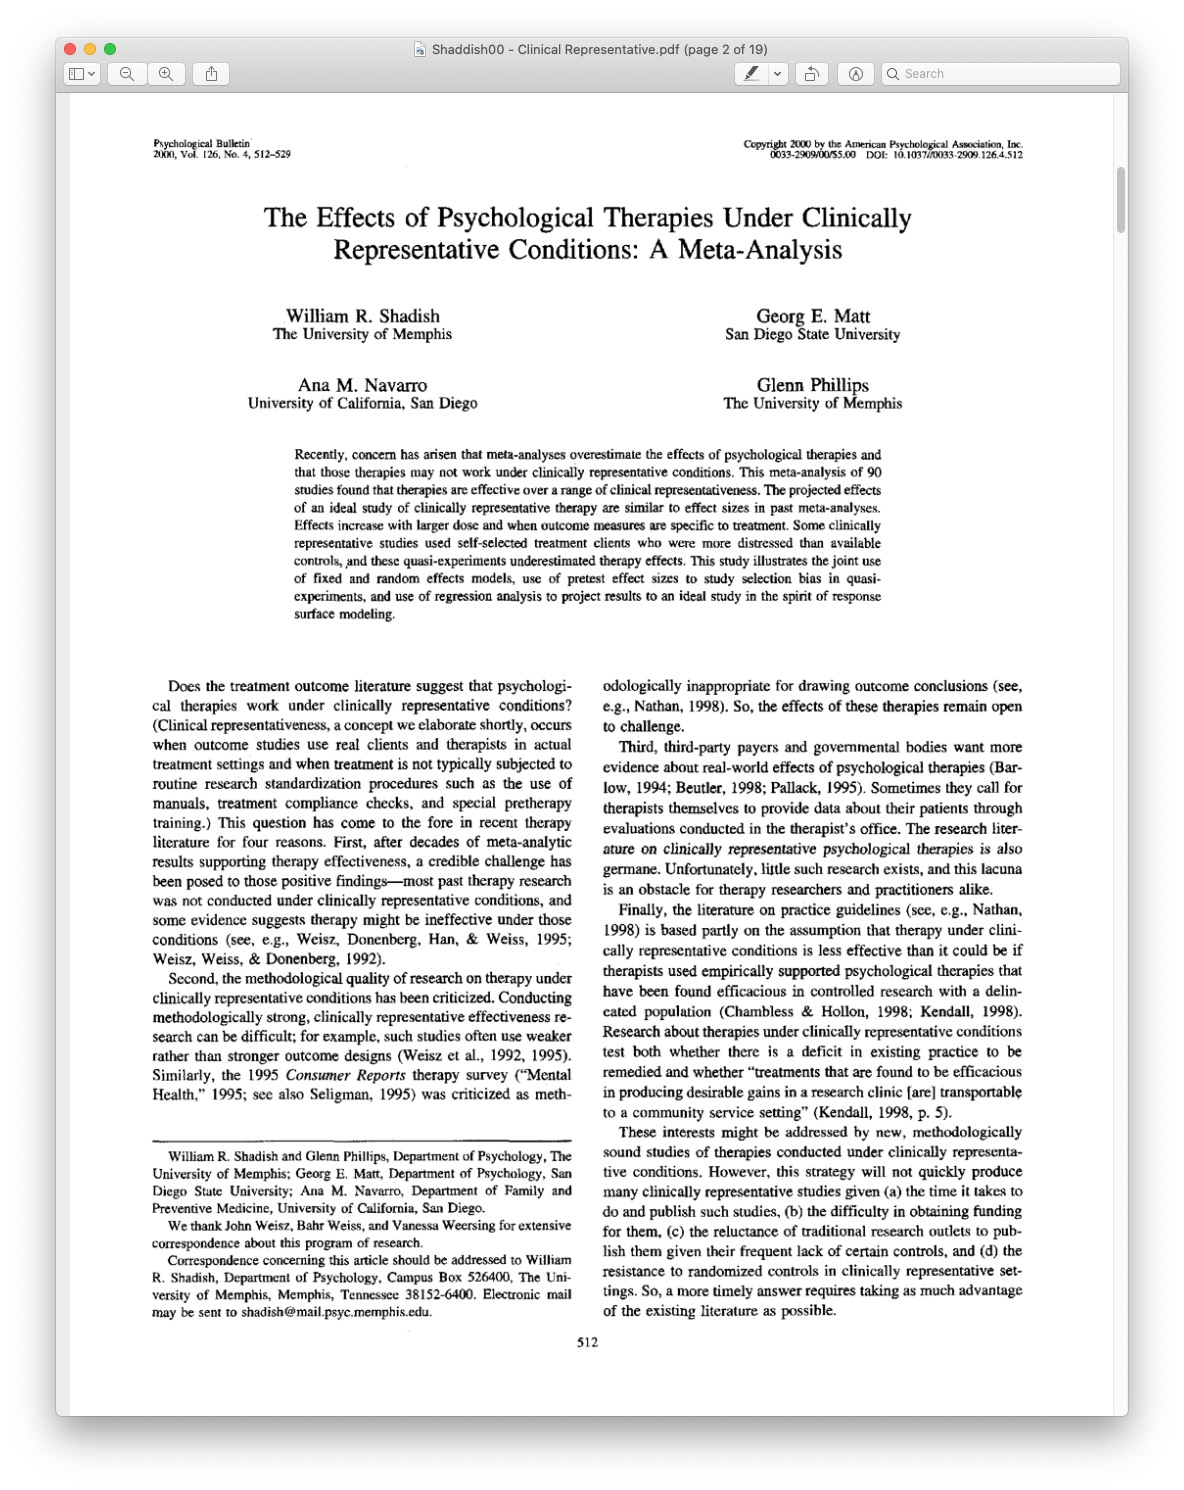
Hour Glass Model
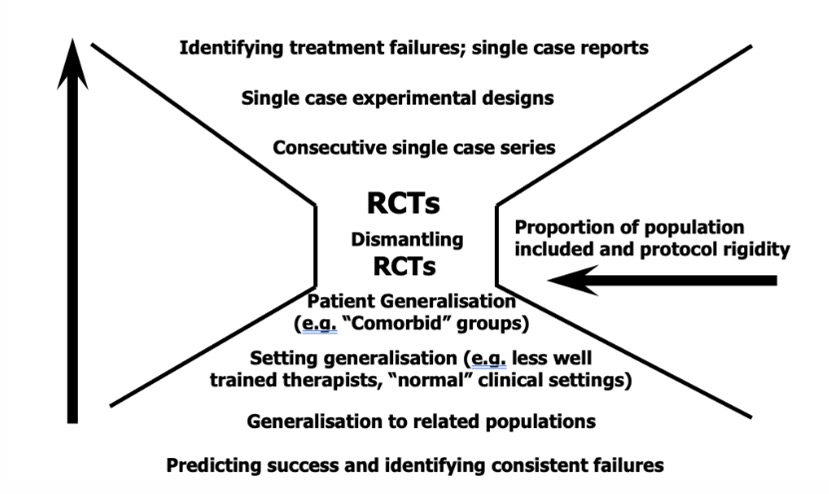
Salkovskis, P. M. (1995). Demonstrating specific effects in cognitive and behavioural therapy, in M. Aveline & D. Shapiro (Eds.), Research foundations for psychotherapy practice (pp. 191–228). Chichester, UK: Wiley. Taken from BABCP: https://babcp.com/Therapists/A-Cognitive-Behavioural-Therapists-Guide-to-Evidence
Past Reviews of Practice Based Research
Rationale
Considerable growth of PBE in the last decade (and ESTs) 📈.
Previous reviews vary in focus/setting.
Benchmarks that apply to a broad range of services are warranted.
Limited prior attempt to explore why effect-sizes differ.
Aim: Broadly review the literature of PBE studies.
Objectives:
Assess the degree to which treatments are effective.
Provide benchmarks for services to compare to.
Examine sources of heterogeneity using moderator variables.
Method
What is a Meta-Analysis?
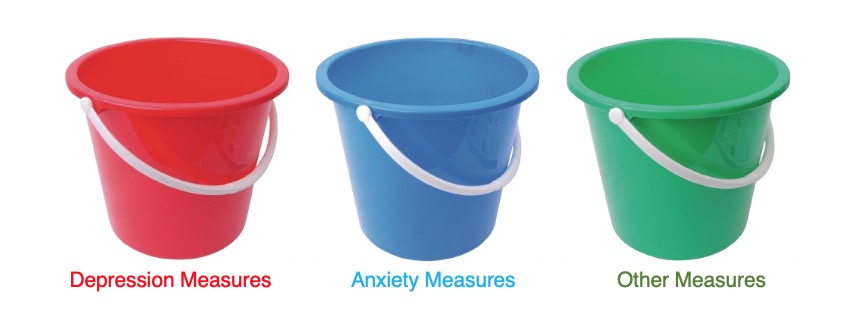
Extract the effect-size from each study, and pool the results into a single effect.
Throwing everything into a bucket and seeing what comes out.
Problem: Statistical Independence
Various possible solutions
- Multiple meta-analyses!
Search Criteria
| Effectiveness | Psychological | Limiters |
|---|---|---|
| Practice based evidence | Psycho* OR Therap [PsycInfo] | English Language |
| Routine practice | Psycho* [CINAHL and MEDLINE] | Adult Sample |
| Benchmarking | ||
| Transportability | ||
| Transferability | ||
| Clinical* representat | ||
| External valid* N0 findings | ||
| Applicab* N0 findings | ||
| Applicab* N0 intervention* | ||
| Empiric* support’ N0 treatment | ||
| Empiric* support’ N0 intervention | ||
| Clinical* Effective*’ | ||
| Dissem* N0 treatment* | ||
| Dissem* N0 intervention* | ||
| Clinical Practice N0 intervention* | ||
| Clinical Practice N0 treatment* | ||
| Service deliv N0 intervention | ||
| Service deliv N0 treatment | ||
| Clinical* effective N2 evaluat | ||
| Service deliv N0 evaluat | ||
| Transporting | ||
| Managed care setting | ||
| Uncontrolled | ||
| Community clinic | ||
| Community mental health centre | ||
| Clinic setting | ||
| Service setting |
Moderators
| Moderator | Levels | Notes |
|---|---|---|
| Categorical | ||
Setting |
a) Outpatient |
|
Analysis |
a) Included all patients |
|
Severity |
a) Mild services (primary care, physical health, university counselling, voluntary, private, EAP). |
|
Modality |
a) Cognitive-behavioral. |
based on manuscript self-designation (i.e., if the manuscript described treatment as CBT, then that was coded). In the absence of these terms, modality of best-fit was decided using treatment descriptions. |
Continent |
a) North America. |
The UK was separated from Europe because of the high representation of outcomes research coming from the UK |
Intervention Development Stage |
a) Preliminary studies (i.e., novel treatments/conditions). |
|
Experience |
a) Trainees. |
|
Measurement Tool |
Measures that were represented at least ten times in the systematic review | |
Sample Size |
a) Small (N ≤ 25). |
|
| Continuous | ||
Age |
Mean average age of sample |
|
Year |
Year of publication |
|
Females |
Rate of females (%) |
|
Findings
PRISMA
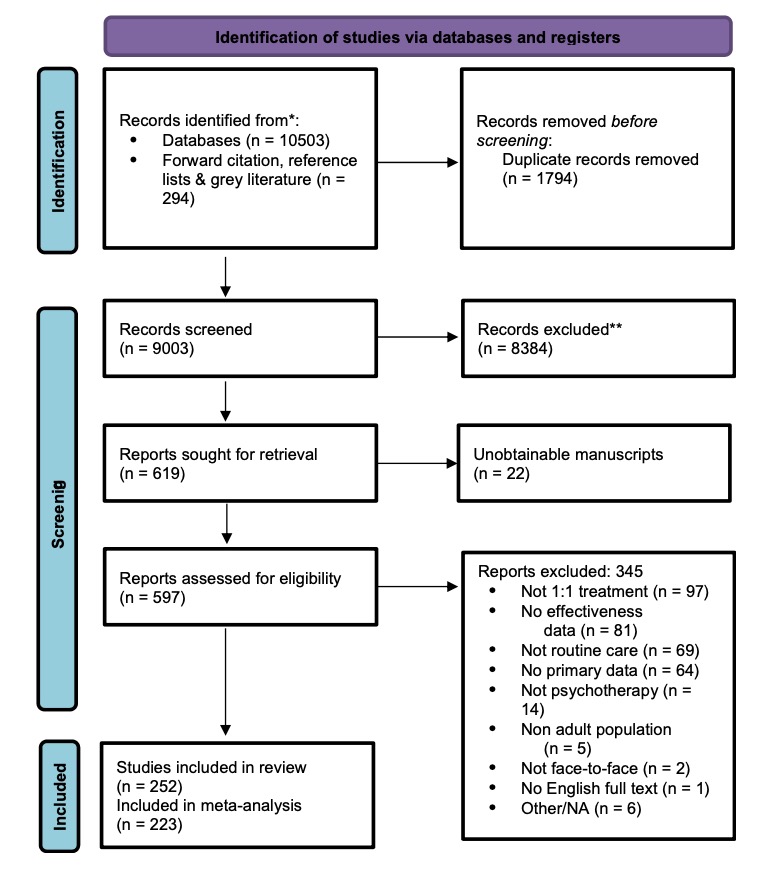
Figure 1: Prisma flow diagram of studies throughout the review
Rates of Effectiveness
| Outcome | k | d | 95% CI | p | I2 | Q |
|---|---|---|---|---|---|---|
Depression |
140 |
0.96 |
0.90-1.06 |
< 0.001 |
98.4 |
3037.46 |
Anxiety |
84 |
0.8 |
0.73-0.92 |
< 0.001 |
97.52 |
1488.88 |
Other |
184 |
1.01 |
0.93-1.08 |
< 0.001 |
98.92 |
15685.18 |
| k = number of studies, d = Cohen's d effect-size, CI = confidence intervals | ||||||
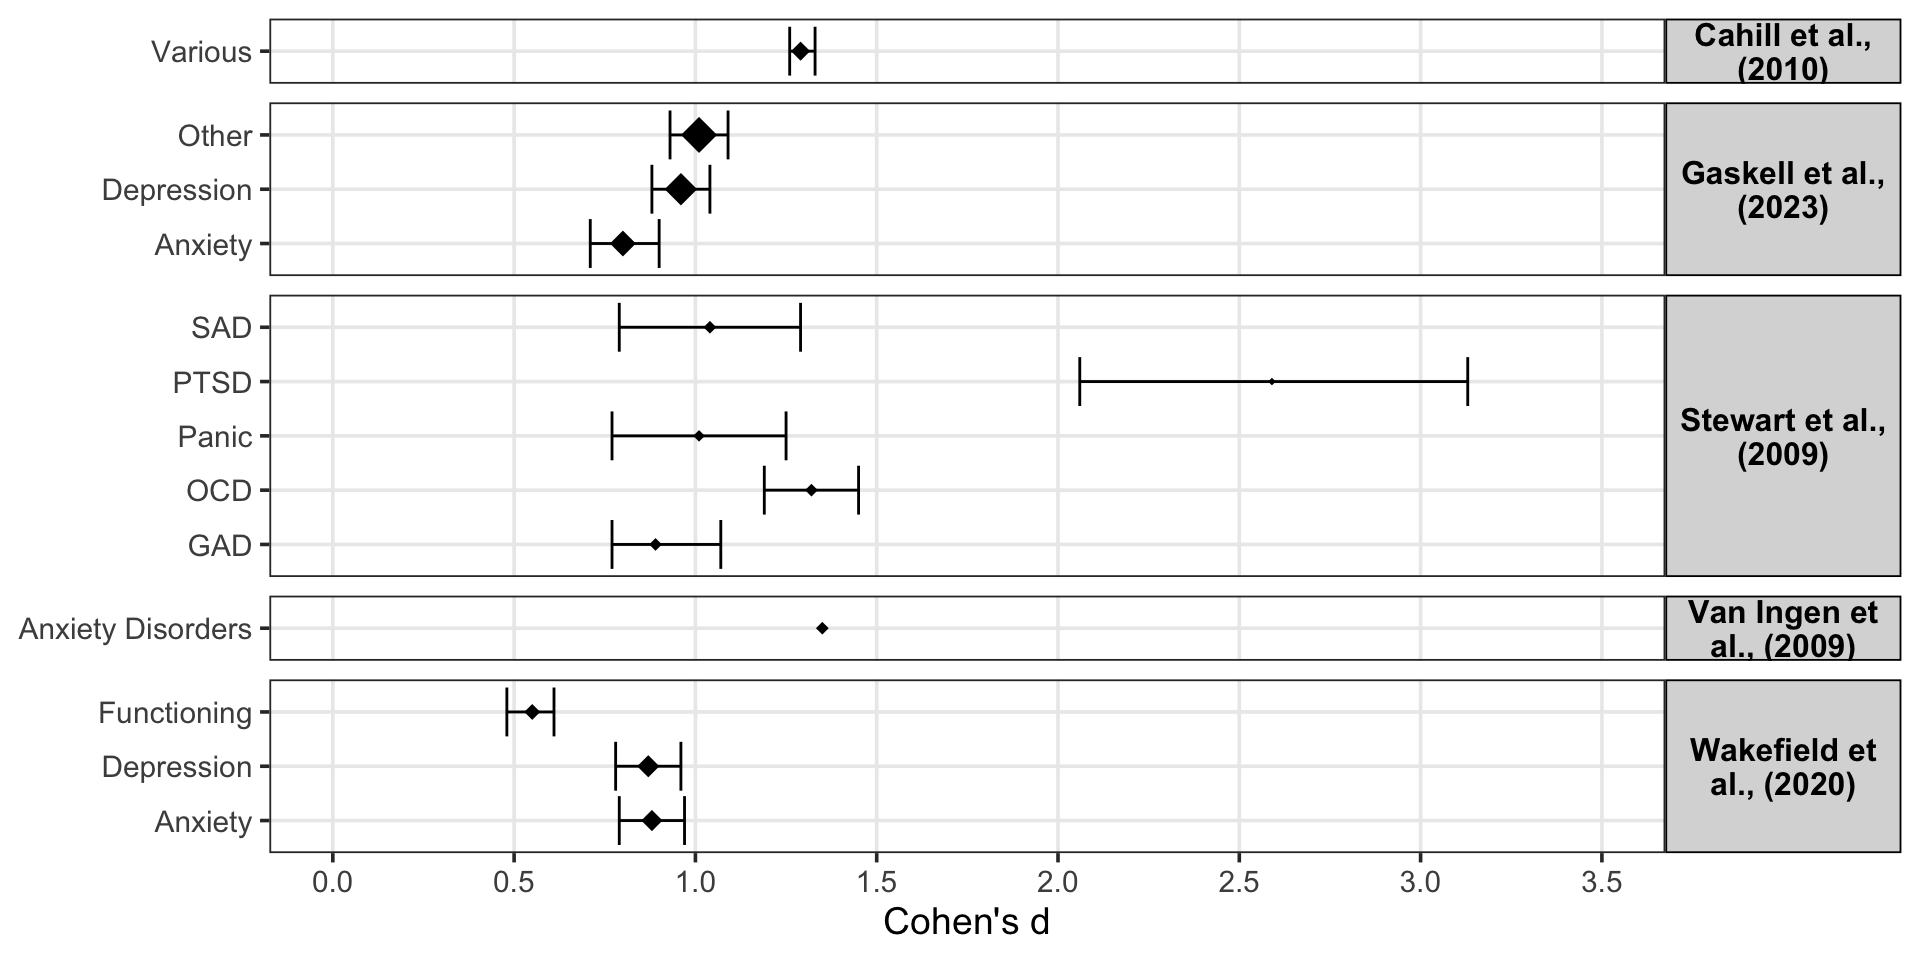
Figure 2: Comparisons to Past Effectiveness Reviews.
Depression
| Depression Outcomes | |||||
| k | d | I2 | 95% CI | Forest Plot | |
|---|---|---|---|---|---|
| Severity | |||||
| Mild | 34 |
1.03 |
100% |
0.85-1.22 |
|
| University | 30 |
0.98 |
100% |
0.79-1.16 |
|
| Secondary | 57 |
0.98 |
100% |
0.86-1.11 |
|
| Residential | 15 |
0.91 |
100% |
0.7-1.12 |
|
| Analysis | |||||
| Include | 81 |
0.93 |
100% |
0.84-1.03 |
|
| Completers | 59 |
1.08 |
100% |
0.94-1.22 |
|
| Setting | |||||
| Outpatient | 121 |
0.99 |
100% |
0.91-1.08 |
|
| Residential | 16 |
0.92 |
100% |
0.72-1.12 |
|
| Continent | |||||
| North America | 58 |
1 |
100% |
0.88-1.11 |
|
| UK | 44 |
1.1 |
100% |
0.94-1.26 |
|
| Mainland Europe | 29 |
0.95 |
100% |
0.77-1.12 |
|
| Australasia | 4 |
0.67 |
100% |
0.33-1.01 |
|
| Asia | 5 |
0.59 |
96% |
0.37-0.8 |
|
| Therapy Modality | |||||
| Psychodynamic | 24 |
1.03 |
100% |
0.86-1.2 |
|
| Counselling | 6 |
0.89 |
100% |
0.69-1.1 |
|
| Cognitive-Behavioural | 90 |
1 |
100% |
0.89-1.11 |
|
| Other | 20 |
0.96 |
100% |
0.75-1.17 |
|
| Tretament Stage | |||||
| Routine Evaluations | 118 |
1 |
100% |
0.91-1.09 |
|
| Preliminary Studies | 22 |
0.95 |
96% |
0.78-1.12 |
|
| Experience | |||||
| Qualified | 121 |
1.01 |
100% |
0.92-1.1 |
|
| Trainees | 19 |
0.9 |
100% |
0.74-1.06 |
|
| Measure | |||||
| BDI | 34 |
1.02 |
100% |
0.86-1.18 |
|
| PHQ 9 | 30 |
1.01 |
100% |
0.81-1.22 |
|
| Sample Size | |||||
| Large | 74 |
1.02 |
100% |
0.91-1.13 |
|
| Small | 33 |
0.85 |
95% |
0.7-0.99 |
|
| Publication Year | |||||
124 |
-0.001 |
||||
| Sample Age | |||||
124 |
-0.004 |
||||
| % Female | |||||
124 |
0.13 |
||||
| k = number of studies, d = Cohen's d effect-size, CI = confidence intervals Summary: d = 0.96, k = 124, Tau2 = 0.17[SE = 0.02], I2 = 99.99%, R2 = 19.28% |
|||||
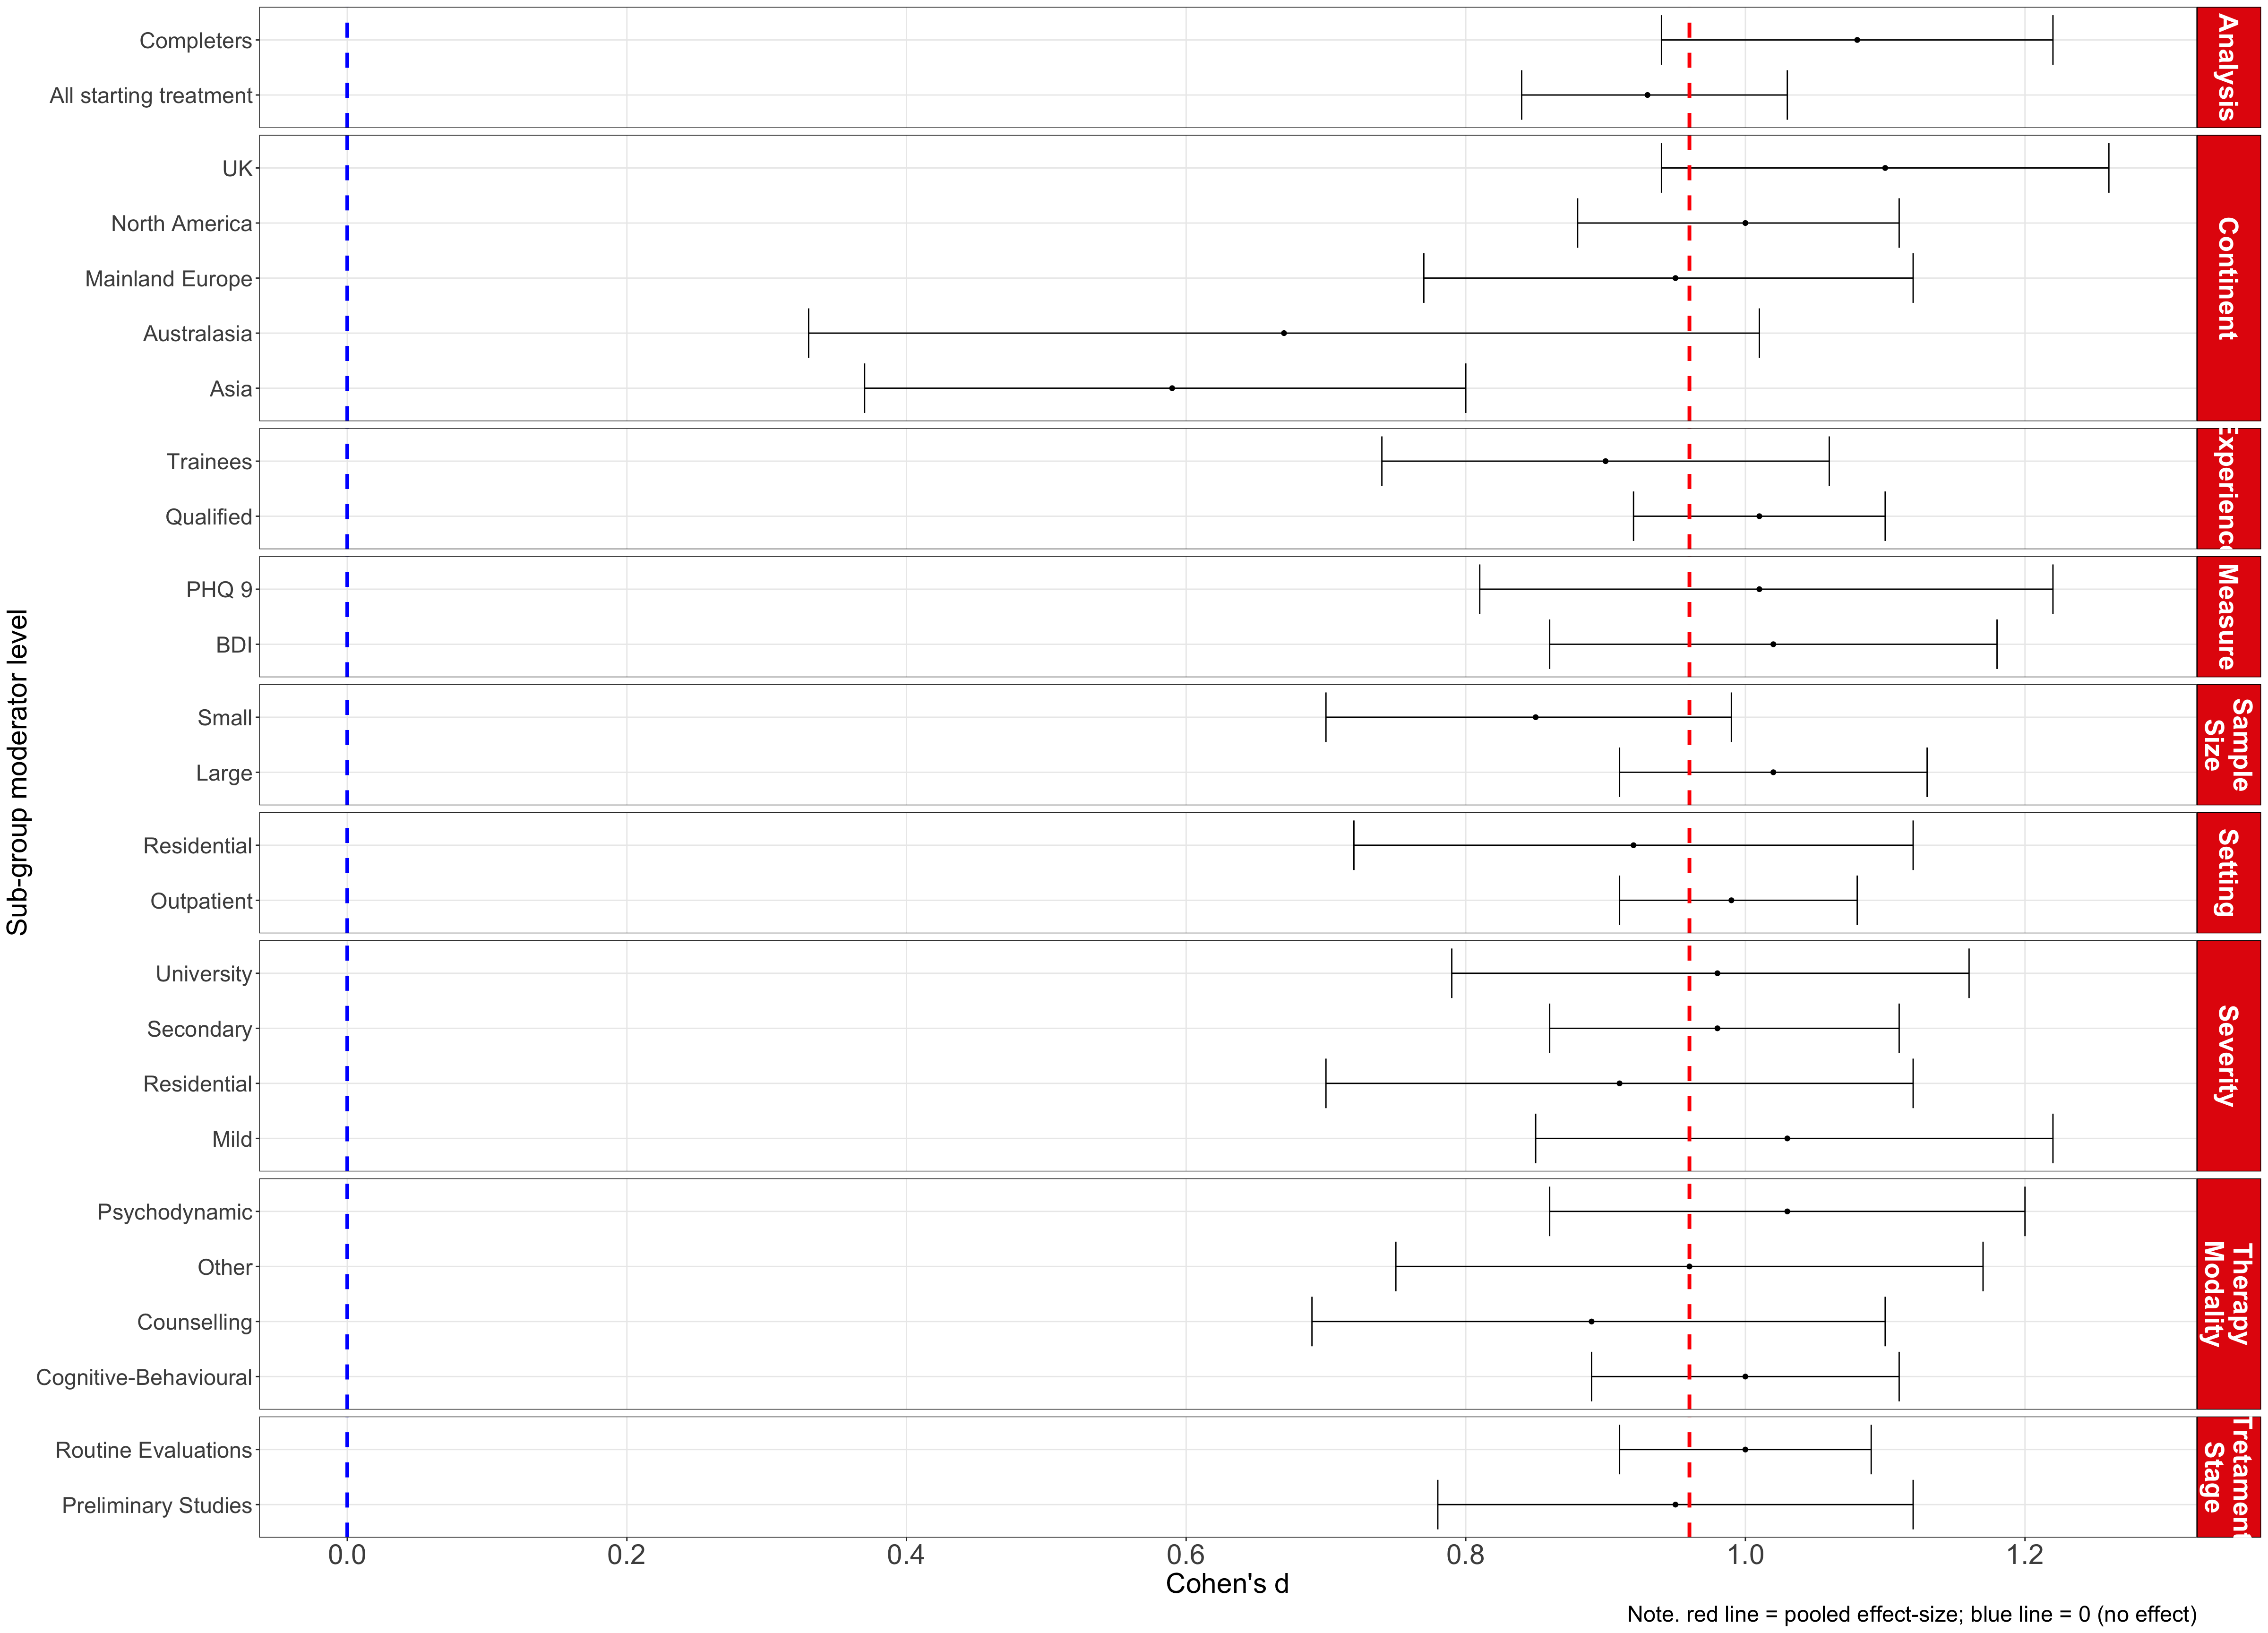
Figure 3: Sub-group (categorical) moderator analyses for depression outcomes.
Anxiety
| Anxiety Outcomes | |||||
| k | Cohen's d | I2 | 95% CI | Forest Plot | |
|---|---|---|---|---|---|
| Severity | |||||
| Mild | 22 | 0.99 | 100% | 0.79-1.2 | |
| Secondary | 24 | 0.63 | 100% | 0.5-0.76 | |
| Residential | 8 | 0.59 | 100% | 0.29-0.9 | |
| University | 29 | 1.01 | 100% | 0.83-1.2 | |
| Analysis | |||||
| Include | 58 | 0.81 | 100% | 0.69-0.93 | |
| Completers | 26 | 0.96 | 100% | 0.77-1.14 | |
| Setting | |||||
| Outpatient | 75 | 0.89 | 100% | 0.78-0.99 | |
| Residential | 9 | 0.58 | 100% | 0.31-0.85 | |
| Continent | |||||
| North America | 32 | 0.91 | 100% | 0.72-1.1 | |
| UK | 25 | 0.89 | 100% | 0.7-1.09 | |
| Mainland Europe | 20 | 0.79 | 100% | 0.65-0.93 | |
| Australasia | 4 | 0.61 | 100% | 0.21-1.01 | |
| Asia | 3 | 0.59 | 40% | 0.49-0.68 | |
| Therapy Modality | |||||
| Psychodynamic | 12 | 0.90 | 100% | 0.75-1.04 | |
| Counselling | 2 | 0.43 | 96% | 0.38-0.49 | |
| Cognitive-Behavioural | 62 | 0.87 | 100% | 0.74-1 | |
| Other | 8 | 0.75 | 100% | 0.53-0.97 | |
| Tretament Stage | |||||
| Routine Evaluations | 74 | 0.85 | 100% | 0.74-0.96 | |
| Preliminary Studies | 10 | 0.87 | 99% | 0.61-1.14 | |
| Experience | |||||
| Qualified | 66 | 0.78 | 100% | 0.68-0.88 | |
| Trainees | 18 | 1.12 | 100% | 0.86-1.39 | |
| Measure | |||||
| BAI | 19 | 0.71 | 100% | 0.54-0.88 | |
| GAD 7 | 19 | 0.96 | 100% | 0.78-1.15 | |
| Sample Size | |||||
| Large | 45 | 0.84 | 100% | 0.72-0.95 | |
| Medium | 13 | 0.93 | 99% | 0.57-1.3 | |
| Small | 26 | 0.84 | 97% | 0.66-1.03 | |
| Publication Year | |||||
| 78 | 0.01 | - | NA | ||
| Sample Age | |||||
| 78 | -0.01 | - | NA | ||
| % Female | |||||
| 78 | -0.22 | - | NA | ||
| k = number of studies, d = Cohen's d effect-size, CI = confidence intervals Summary: d = 0.8, k = 78, Tau2 = 0.13[SE = 0.02], I2 = 99.95%, R2 = 40.55% |
|||||
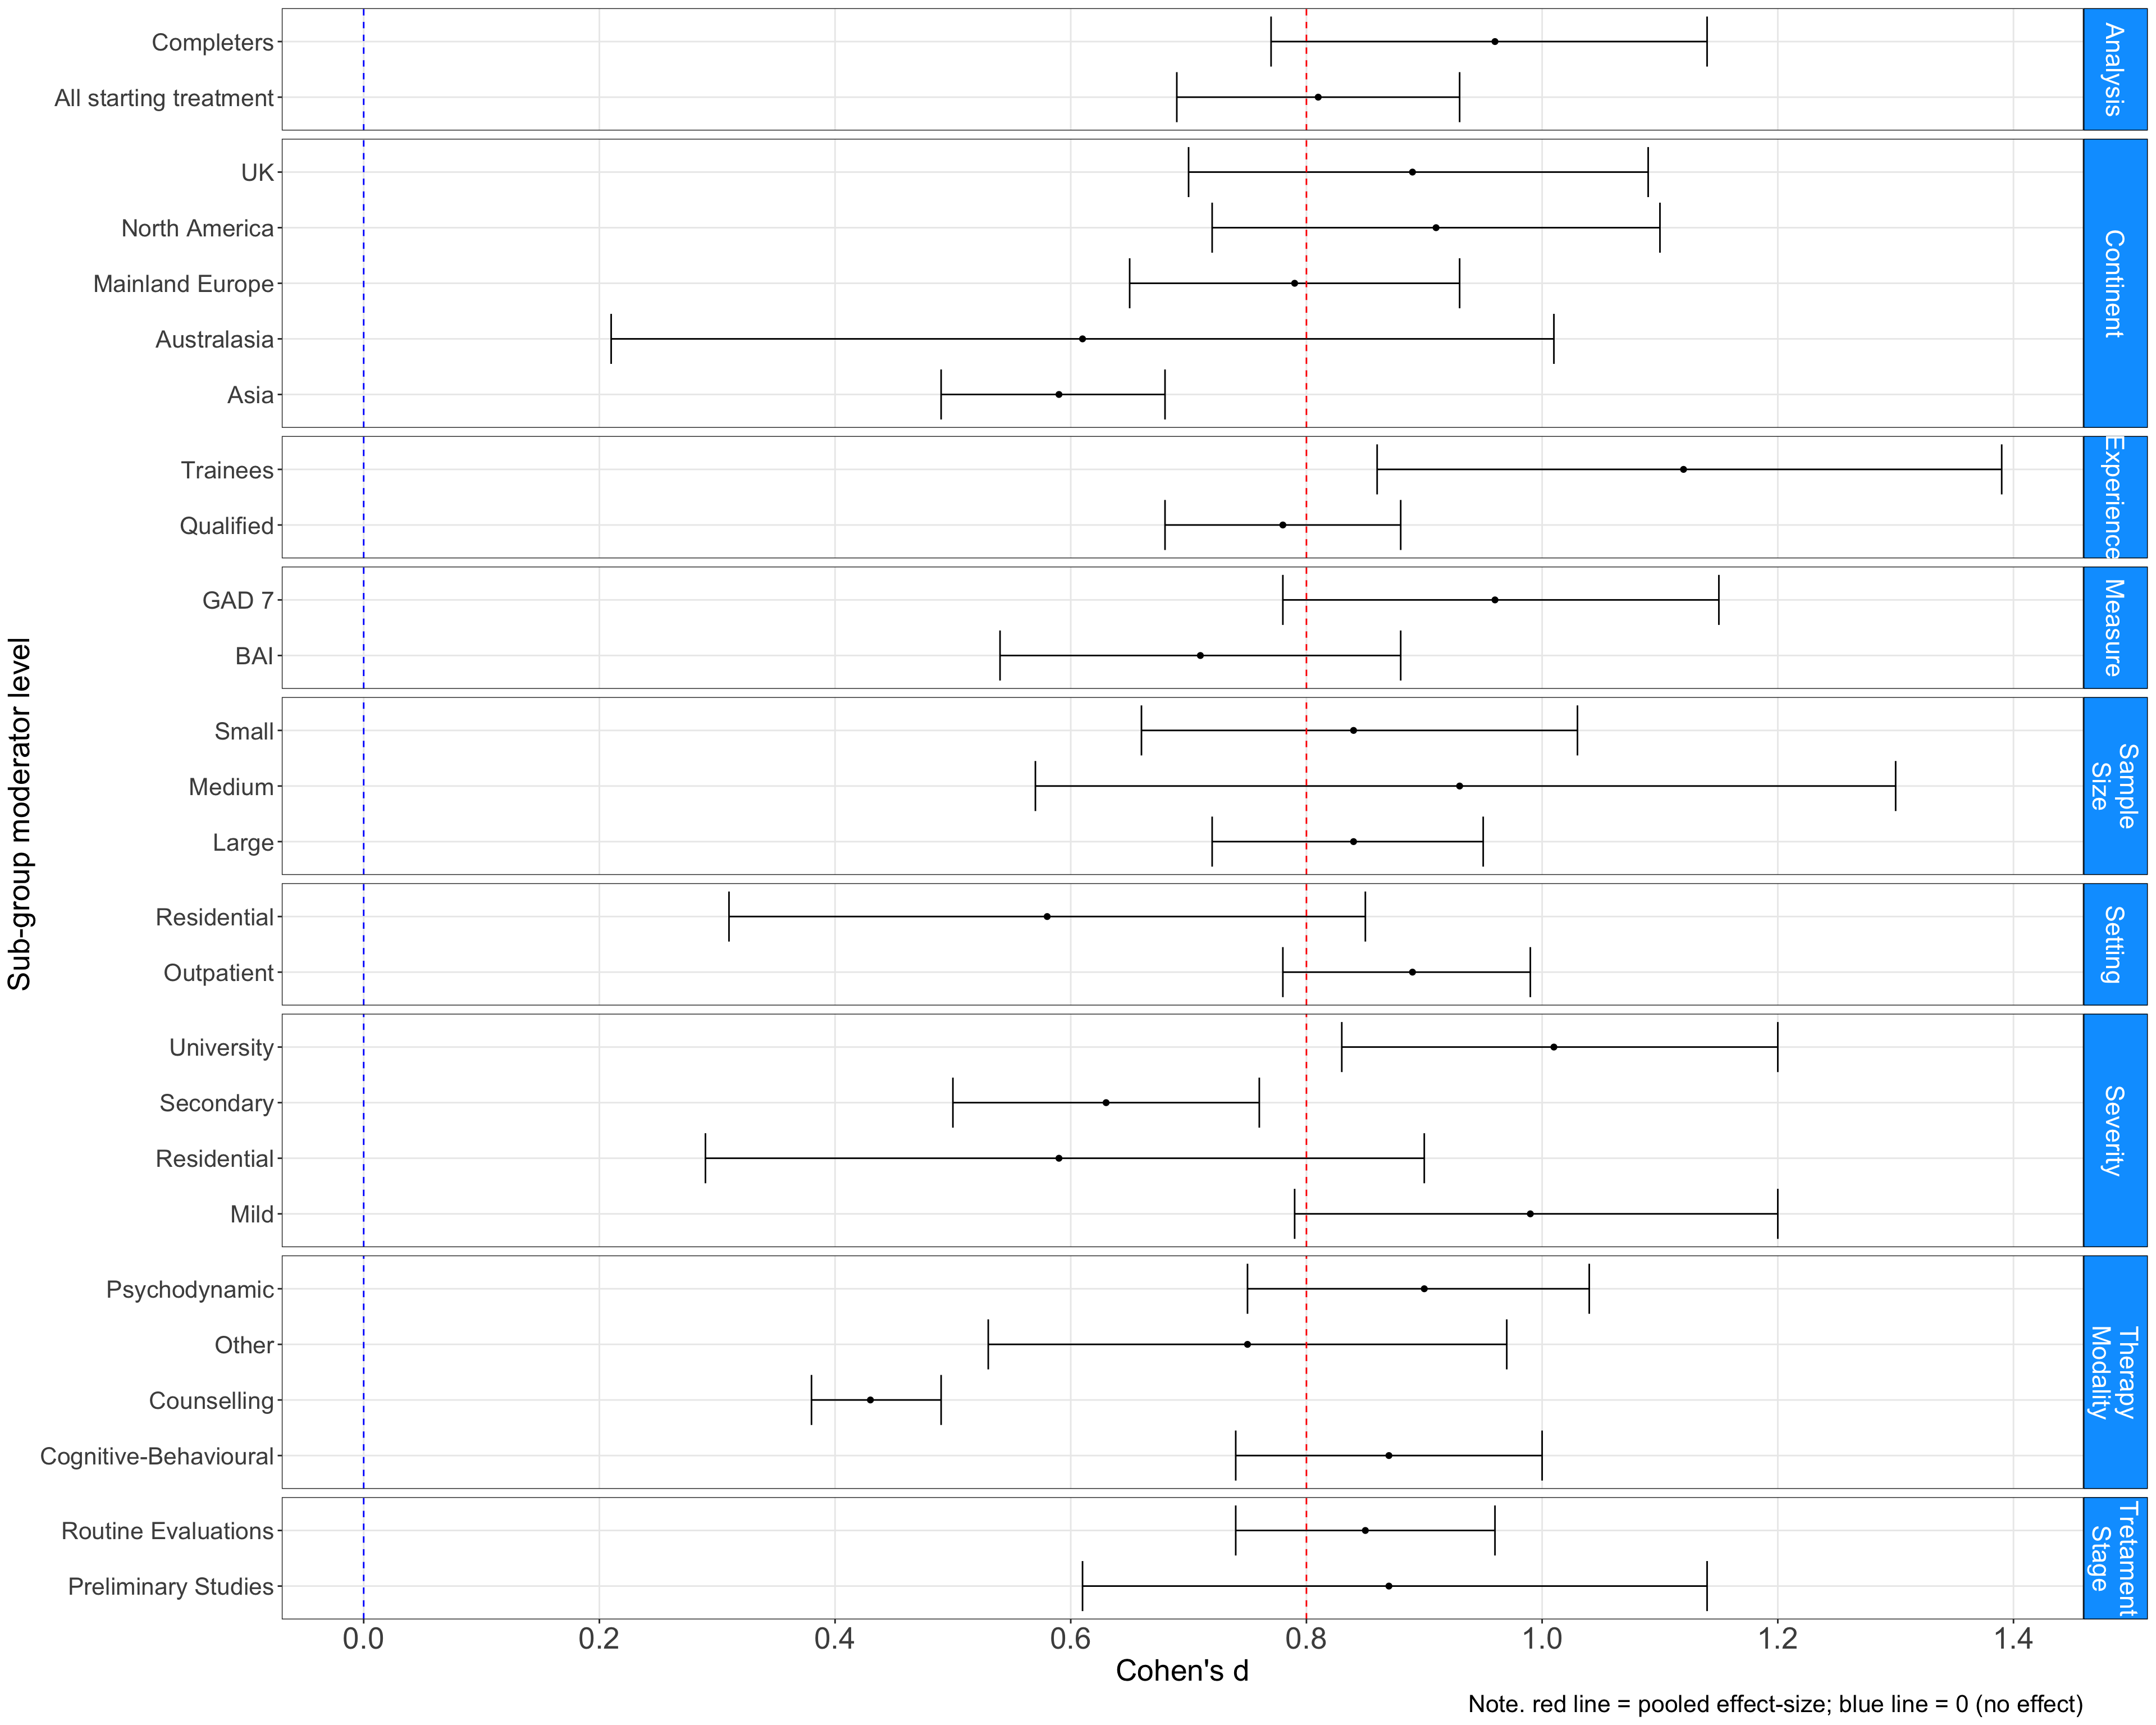
Figure 4: Sub-group (categorical) moderator analyses for anxiety outcomes.
Other
| Other Outcomes | |||||
| k | Cohen's d | I2 | 95% CI | Forest Plot | |
|---|---|---|---|---|---|
| Severity | |||||
| Mild | 61 | 1.08 | 100% | 0.95-1.21 | |
| Secondary | 62 | 0.98 | 100% | 0.84-1.12 | |
| Residential | 27 | 1.09 | 100% | 0.91-1.26 | |
| University | 28 | 0.82 | 100% | 0.7-0.95 | |
| Analysis | |||||
| Include | 95 | 0.98 | 100% | 0.87-1.09 | |
| Completers | 89 | 1.08 | 100% | 0.97-1.18 | |
| Setting | |||||
| Outpatient | 153 | 1.00 | 100% | 0.92-1.08 | |
| Residential | 28 | 1.08 | 100% | 0.91-1.25 | |
| Continent | |||||
| UK | 68 | 1.02 | 100% | 0.92-1.13 | |
| North America | 60 | 1.07 | 100% | 0.9-1.25 | |
| Mainland Europe | 47 | 1.00 | 100% | 0.88-1.12 | |
| Australasia | 4 | 0.81 | 99% | 0.72-0.9 | |
| Asia | 5 | 0.90 | 99% | 0.61-1.2 | |
| Therapy Modality | |||||
| Cognitive-Behavioural | 83 | 1.18 | 100% | 1.05-1.32 | |
| Psychodynamic | 36 | 0.93 | 100% | 0.79-1.07 | |
| Counselling | 19 | 0.90 | 100% | 0.75-1.06 | |
| Other | 46 | 0.87 | 100% | 0.76-0.98 | |
| Tretament Stage | |||||
| Preliminary Studies | 24 | 1.06 | 100% | 0.82-1.29 | |
| Routine Evaluations | 160 | 1.02 | 100% | 0.94-1.1 | |
| Experience | |||||
| Qualified | 158 | 1.07 | 100% | 0.99-1.16 | |
| Trainees | 26 | 0.77 | 100% | 0.65-0.89 | |
| Measure | |||||
| BSI-GSI | 26 | 0.87 | 100% | 0.73-1 | |
| CORE-OM | 35 | 1.04 | 100% | 0.9-1.18 | |
| OQ-45 | 13 | 0.57 | 100% | 0.41-0.74 | |
| SCL (Global) | 22 | 1.05 | 100% | 0.87-1.23 | |
| PCL | 12 | 1.29 | 100% | 0.97-1.61 | |
| Sample Size | |||||
| Large | 110 | 1.01 | 100% | 0.92-1.1 | |
| Medium | 38 | 1.11 | 99% | 0.92-1.3 | |
| Small | 36 | 0.99 | 97% | 0.81-1.18 | |
| Publication Year | |||||
| 153 | 0.00 | - | NA | ||
| Sample Age | |||||
| 153 | 0.00 | - | NA | ||
| % Female | |||||
| 153 | -0.14 | - | NA | ||
| k = number of studies, d = Cohen's d effect-size, CI = confidence intervals Summary: d = 1.01, k = 153, Tau2 = 0.24[SE = 0.03], I2 = 100%, R2 = 21.44% |
|||||
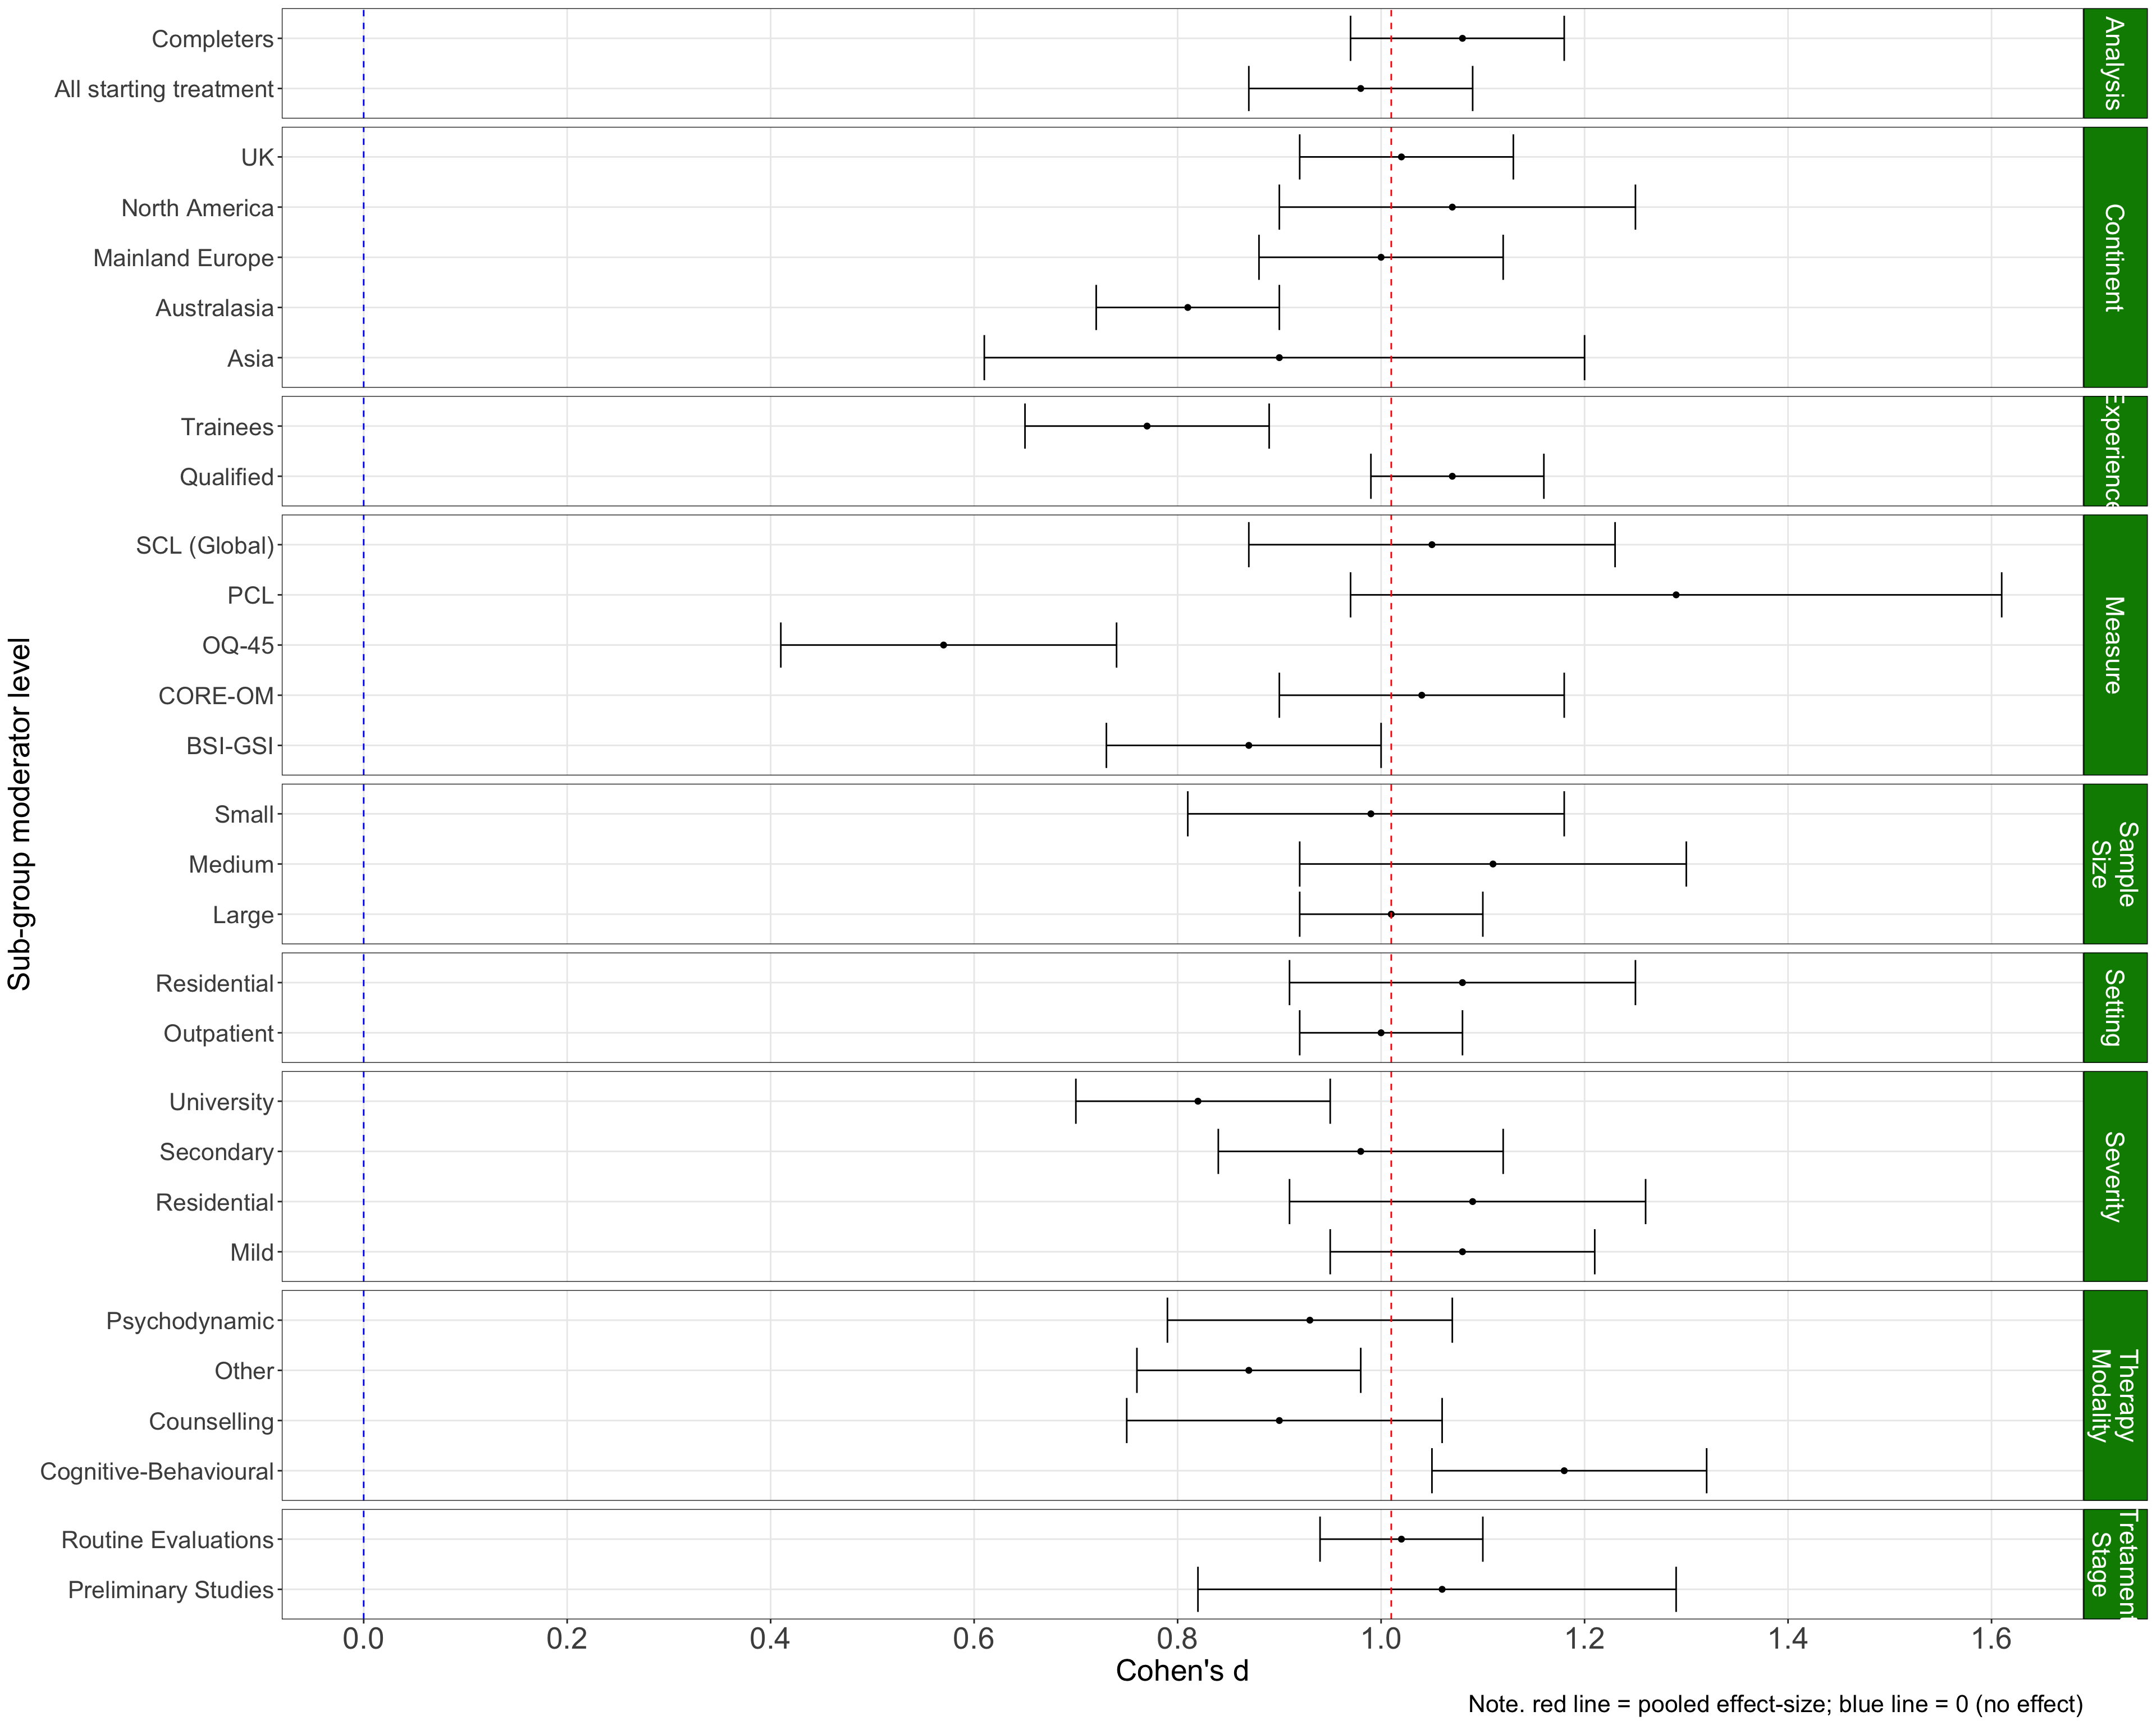
Figure 5: Sub-group (categorical) moderator analyses for other outcomes.
Multiple Meta Regression
| Multi-Meta Regression | ||||
| Depression | Anxiety | Other | Notes | |
|---|---|---|---|---|
| Continent | ✅ |
✅ |
❌ |
Depression: UK samples had larger effect sizes compared to samples from Asia. |
| Severity | ❌ |
✅ |
❌ |
Anxiety: Mild samples had larger effect sizes than moderate or severe samples. |
| Modality | ❌ |
✅ |
✅ |
Anxiety: CBT outperformed counselling interventions. |
| Treatment Stage | ❌ |
❌ |
❌ |
|
| Analysis | ✅ |
❌ |
❌ |
Depression: completer samples outperformed ITT. |
| Experience | ✅ |
❌ |
❌ |
Depression: qualified staff outperformed trainees. |
| Sample Size | ❌ |
❌ |
❌ |
|
| Publication Year | ❌ |
❌ |
❌ |
|
| Sample Age | ❌ |
❌ |
❌ |
|
| % Female | ❌ |
❌ |
❌ |
|
Benchmarks
| Benchmarks | |||
| Cohen's d | 95% CI | Forest Plot | |
|---|---|---|---|
| Anxiety - Outpatient Services | |||
| Top 25% | 1.56 |
1.38-1.73 |
|
| Average | 0.84 |
0.78-0.89 |
|
| Bottom 25% | 0.37 |
0.33-0.42 |
|
| Anxiety - Inpatient Services | |||
| Top 25% | 1.07 |
1.04-1.09 |
|
| Average | 0.67 |
0.42-0.92 |
|
| Bottom 25% | 0.13 |
0.03-0.29 |
|
| Anxiety - University Outpatient Clinics | |||
| Top 25% | 1.8 |
1.57-2.02 |
|
| Average | 1.8 |
1.57-2.02 |
|
| Bottom 25% | 0.51 |
0.44-0.57 |
|
| Depression - Outpatient Services | |||
| Top 25% | 1.68 |
1.53-1.83 |
|
| Average | 0.94 |
0.9-0.97 |
|
| Bottom 25% | 0.46 |
0.41-0.52 |
|
| Depression - Inpatient Services | |||
| Top 25% | 1.34 |
1.16-1.52 |
|
| Average | 0.98 |
0.81-1.15 |
|
| Bottom 25% | 0.38 |
0.26-0.5 |
|
| Depression - University Outpatient Clinics | |||
| Top 25% | 1.77 |
1.5-2.03 |
|
| Average | 0.91 |
0.87-0.95 |
|
| Bottom 25% | 0.4 |
0.27-0.54 |
|
| Other - Outpatient Services | |||
| Top 25% | 1.7 |
1.54-1.86 |
|
| Average | 0.92 |
0.89-0.96 |
|
| Bottom 25% | 0.49 |
0.43-0.54 |
|
| Other - Inpatient Services | |||
| Top 25% | 1.67 |
1.37-1.97 |
|
| Average | 1.04 |
0.96-1.11 |
|
| Bottom 25% | 0.58 |
0.46-0.69 |
|
| Other - University Counselling Centers | |||
| Top 25% | 1.47 |
1.24-1.69 |
|
| Average | 0.94 |
0.84-1.03 |
|
| Bottom 25% | 0.64 |
0.61-0.67 |
|
| Other - University Outpatient Clinics | |||
| Top 25% | 1.14 |
1.1-1.18 |
|
| Average | 0.86 |
0.77-0.94 |
|
| Bottom 25% | 0.41 |
0.23-0.59 |
|
What it means
What it Means?
- Broadest meta-analytic study of routine therapy outcomes (N = 233,140, k = 223)
- Comparable (large) rates of effectiveness to other reviews of practice based evidence.
- All continents demonstrated positive change (d = 0.59–1.10) supporting the universality hypothesis (i.e., that psychotherapy is assumed to work across cultures; Flückiger et al., 2018).
- Some interesting findings from moderators (however there are power issues).
Making Sense of the Moderators
- Continental Differences? UK/US appeared to outperform some regions.
- Potentially influenced by differences in models of training, service structures, therapy provision and emphasis on evidence-based practice?
- Note. Some continents had very few studies.
- So is Severity not Associated with Effect-Size?
- Inpatient anxiety samples fared less well.
- Baseline severity not important for depression?
- Note. Was our variable an Imprecise proxy?
- Long live the Dodo Bird?
- CBT outperformed other treatments for the other outcomes category. Potentially due to influence on specific conditions (e.g., PTSD, OCD)?
- Absence of evidence for CBT being superior for anxiety or depression category outcomes.
- Maybe there is something to say for Clinician Experience?
- Qualified clinicians out performed trainees for depression and other category outcomes.
- Trainees fared slightly better for anxiety.
- Potentially less likely to drift from EBP?
Limitations
Limitations and Opportunities
- ❌ Reliance on Observational Evidence.
- ❌ Outcome Domains & Statistical Dependency
- ❌ Did Treatments Intended = Treatment Received.
- ❌ Only Reflects Changes During Treatment Phase.
- ❌ Exclusively Self-Report Data.
- ✅ Nevertheless, valuable benchmarks.
- ✅ Robust variance and/or IPDMA.
- ✅ Re-analysis Focusing upon Fidelity Checks.
- ✅ Re-analysis Focusing upon Follow Up Evidence.
- ✅ Reliance upon Clinician Report as Moderator.
Conclusions
Conclusion
Treatments are highly effective in routine practice.
Nevertheless, effects vary considerably across services.
Performance benchmarks may help routine services through evaluation and practice development initiatives.
Next step: Do treatment effects last?
Developments
Publication
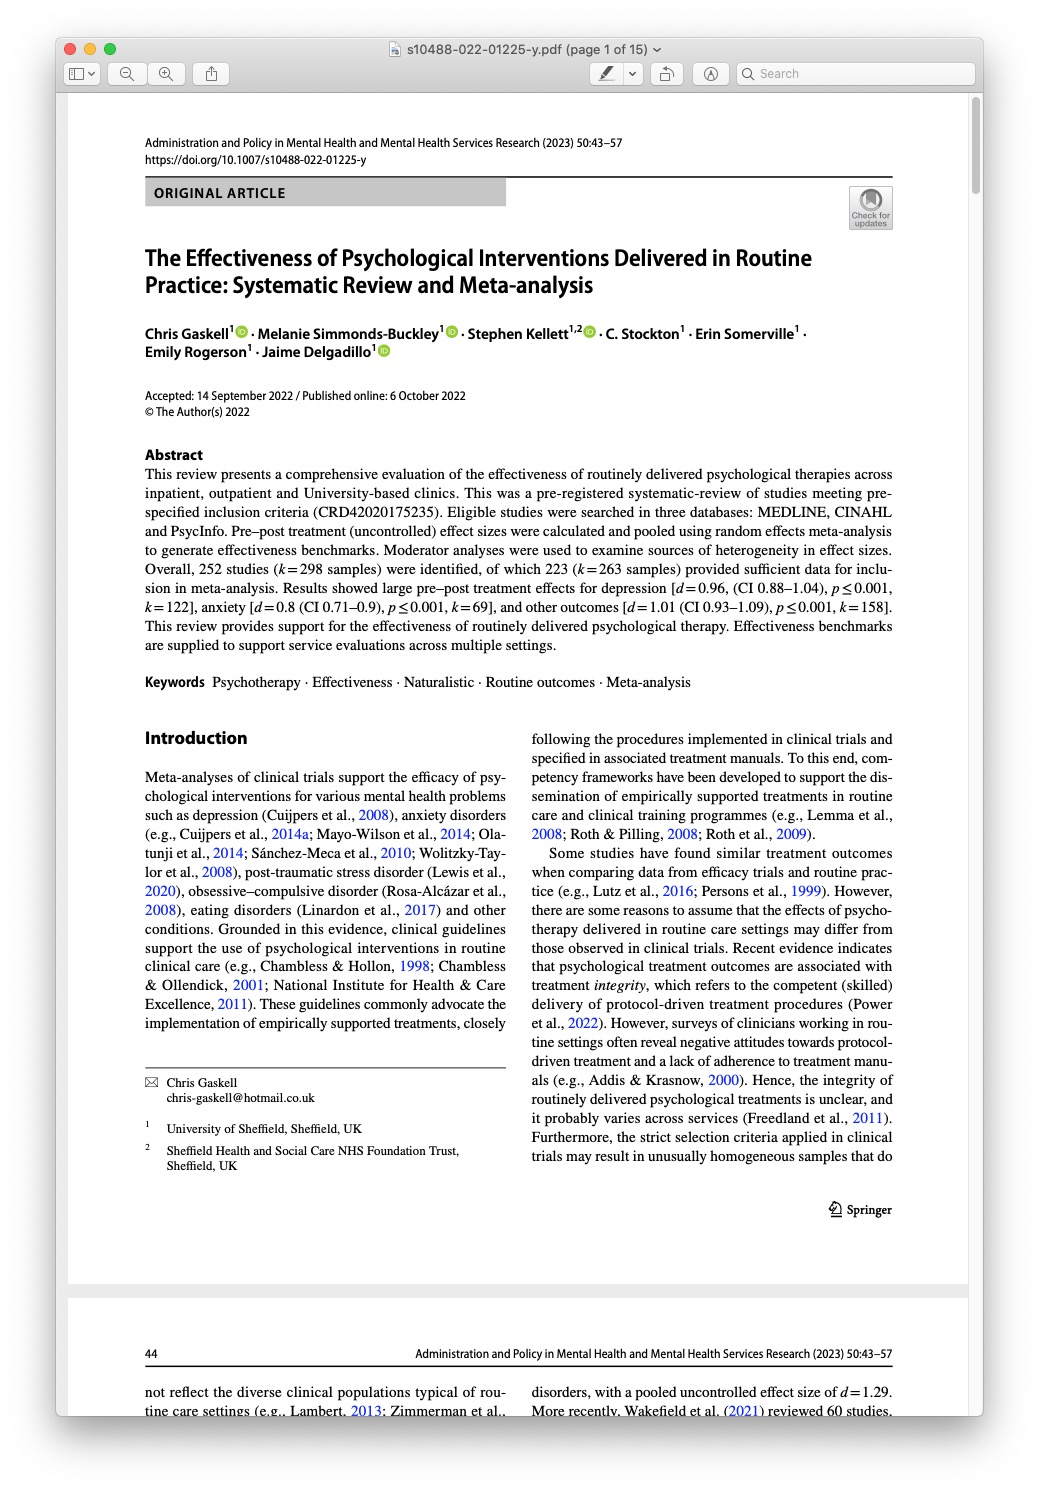
Web App
Allows services to generate an effect-size and compare it to benchmarks from the paper.
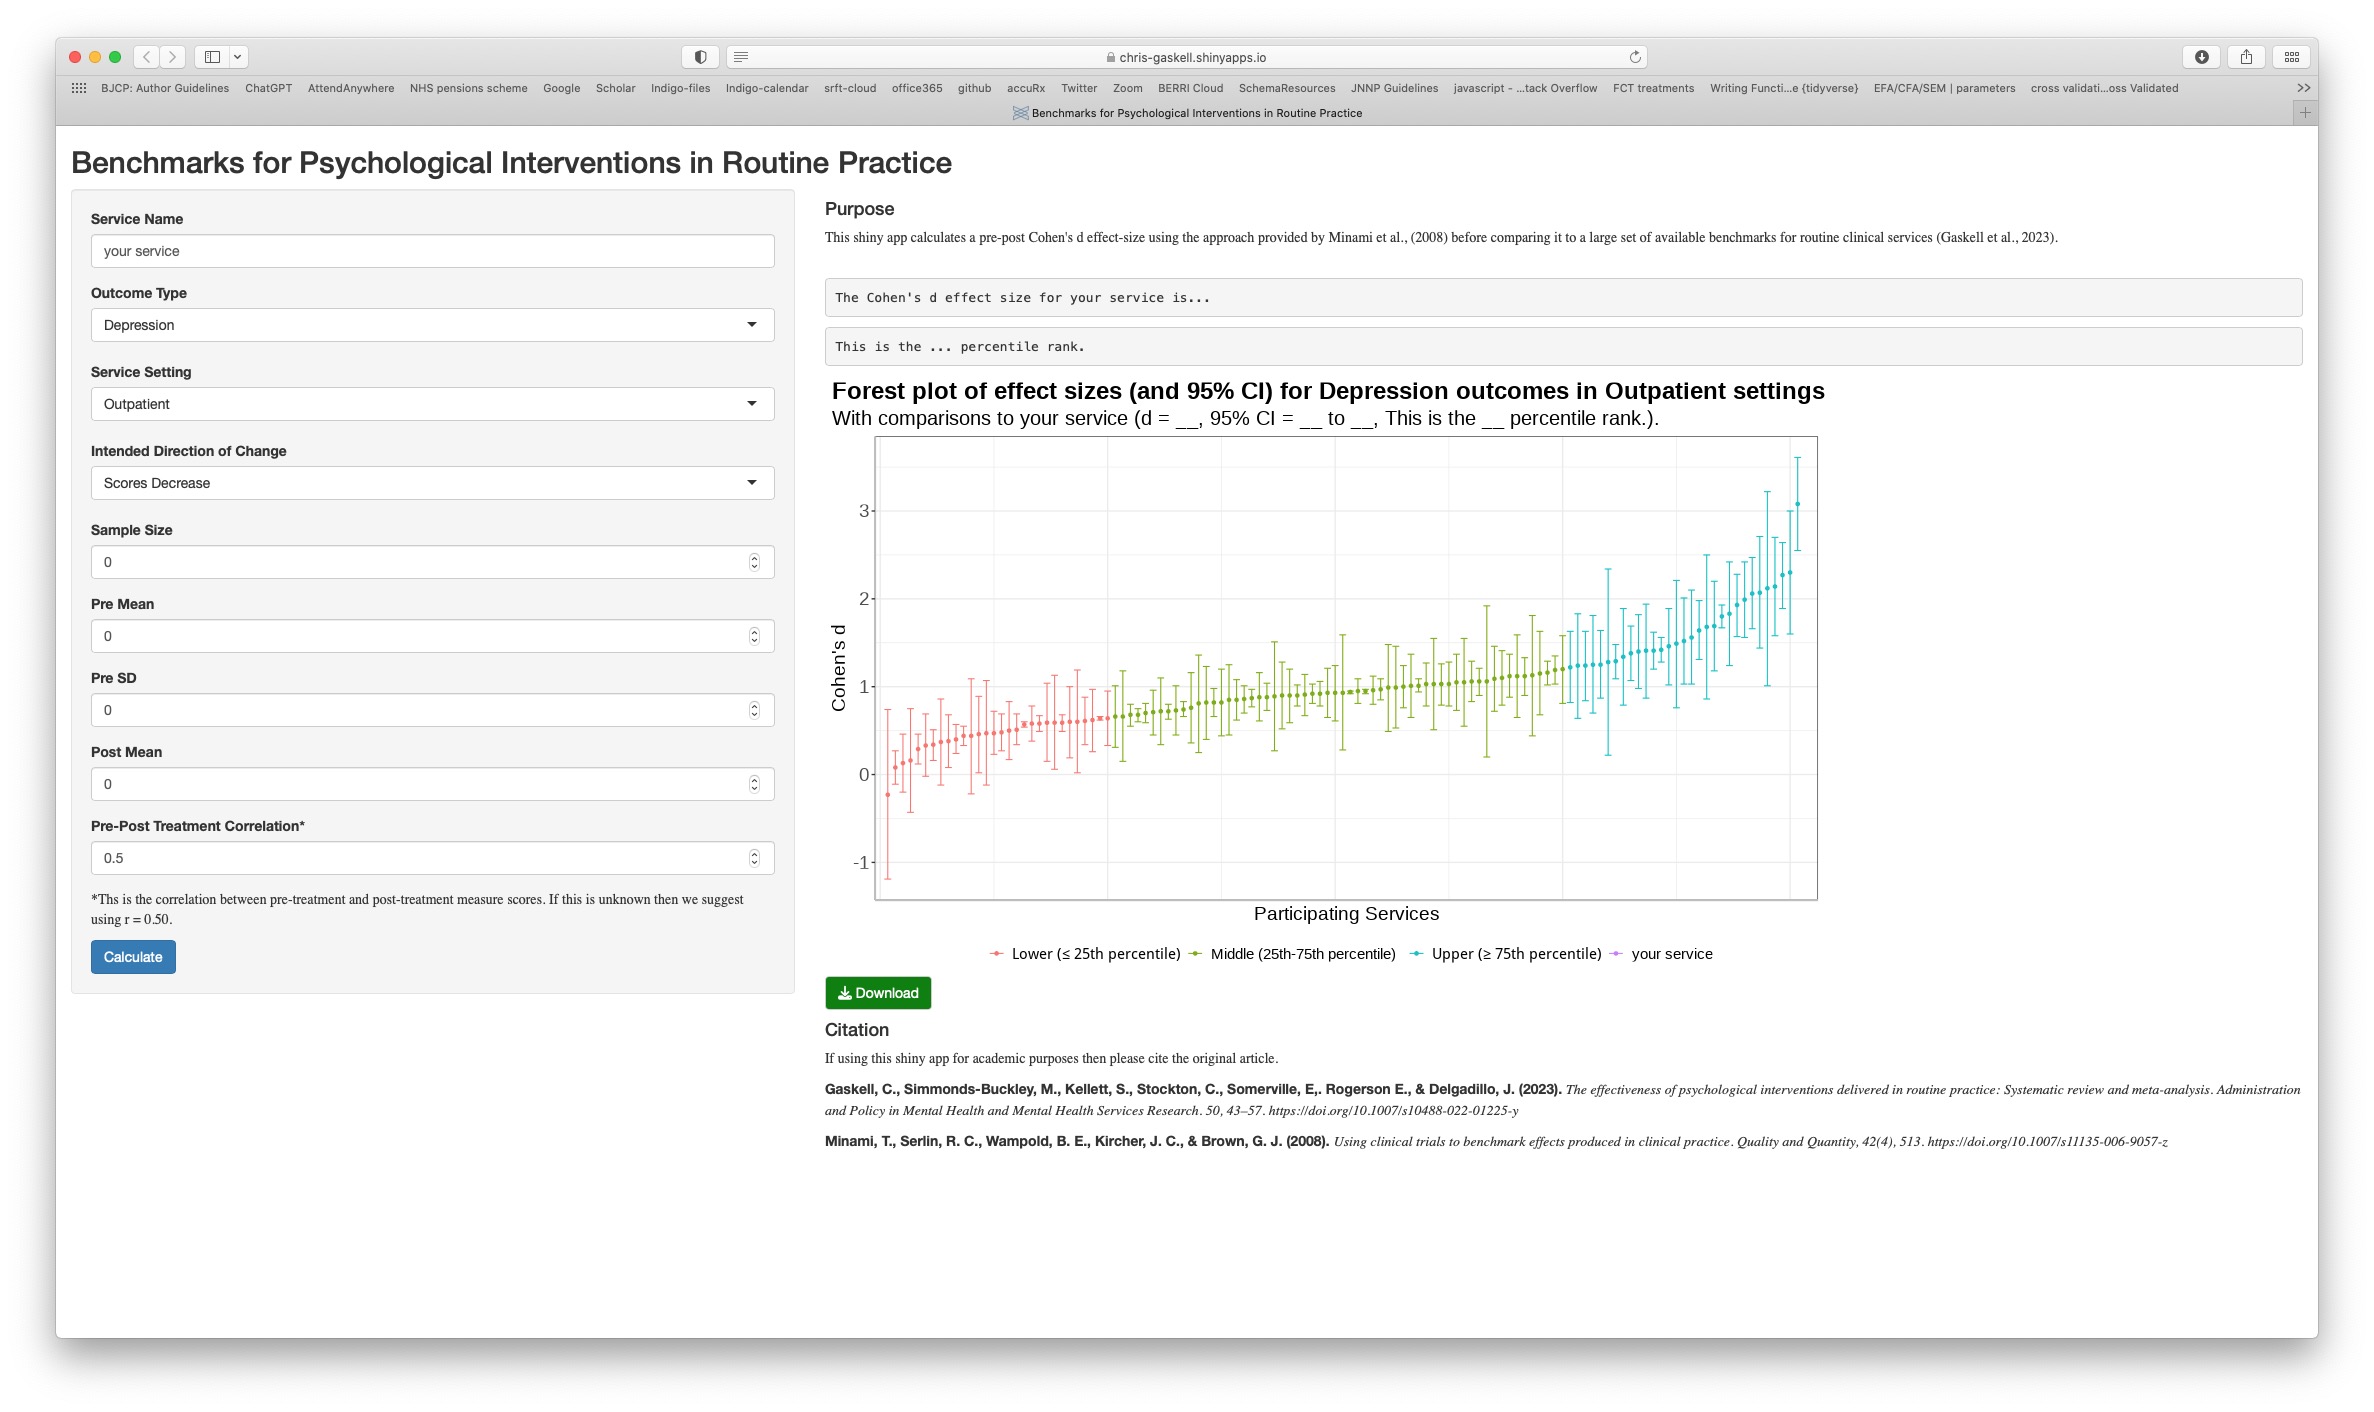
Shiny App for plotting benchmarks.
Thanks for Listening!
Effectiveness of Routine Psychological Interventions
